
Geospatial Intelligence API
Flood risk, model-ready for
every UK property.
Property-level flood risk metrics for every UK address, in a single API built for lending, insurance, and PropTech.
Built on Definitive UK address data


Properties scored
0M+
Projection horizon
0
Compliance-ready data
Meet PRA SS5/25 and SS1/23 requirements with data that maps to every obligation, so you can close your June 2026 compliance gap without a custom build.

Property-level scoring
Risk assessed per UPRN across ~40M properties, not by postcode or flood zone, so every SS5/25 submission reflects actual property exposure.
Confidence scoring
Every response includes a 1–10 confidence score so you can quantify model uncertainty at each location and meet SS5/25 data quality disclosure requirements.
Multi-source flood coverage
Rivers and sea, surface water, and coastal risk modelled independently in a single response, satisfying the requirement for multiple flood source assessment.
Stress scenario coverage
Pre-built severe-but-plausible stress sets ready for ICAAP submissions and regulatory disclosure without needing a separate data source or custom build.
Forward climate projections
2050 and 2080 scenarios under RCP 4.5 and 8.5 with depth and frequency data so you can demonstrate long-term climate risk assessment to regulators.
Transparent data sourcing
Every data layer attributed to its government source (Environment Agency, SEPA, and Natural Resources Wales) with full documentation for audit purposes.
Depth and severity metrics
Depth bands, velocity, and hazard scores returned per flood source and per property, going well beyond the binary zone codes SS5/25 considers insufficient.
Full model governance
Complete methodology documentation, auditable data pipeline, and zero black-box components to satisfy SS1/23 model risk management requirements.
Property-level scoring
Risk assessed per UPRN across ~40M properties, not by postcode or flood zone, so every SS5/25 submission reflects actual property exposure.
Multi-source flood coverage
Rivers and sea, surface water, and coastal risk modelled independently in a single response, satisfying the requirement for multiple flood source assessment.
Forward climate projections
2050 and 2080 scenarios under RCP 4.5 and 8.5 with depth and frequency data so you can demonstrate long-term climate risk assessment to regulators.
Depth and severity metrics
Depth bands, velocity, and hazard scores returned per flood source and per property, going well beyond the binary zone codes SS5/25 considers insufficient.
Confidence scoring
Every response includes a 1–10 confidence score so you can quantify model uncertainty at each location and meet SS5/25 data quality disclosure requirements.
Stress scenario coverage
Pre-built severe-but-plausible stress sets ready for ICAAP submissions and regulatory disclosure without needing a separate data source or custom build.
Transparent data sourcing
Every data layer attributed to its government source (Environment Agency, SEPA, and Natural Resources Wales) with full documentation for audit purposes.
Full model governance
Complete methodology documentation, auditable data pipeline, and zero black-box components to satisfy SS1/23 model risk management requirements.
Flood exposure in one call.
Property-level flood exposure with metrics you can plug straight into lending, insurance, or location products.
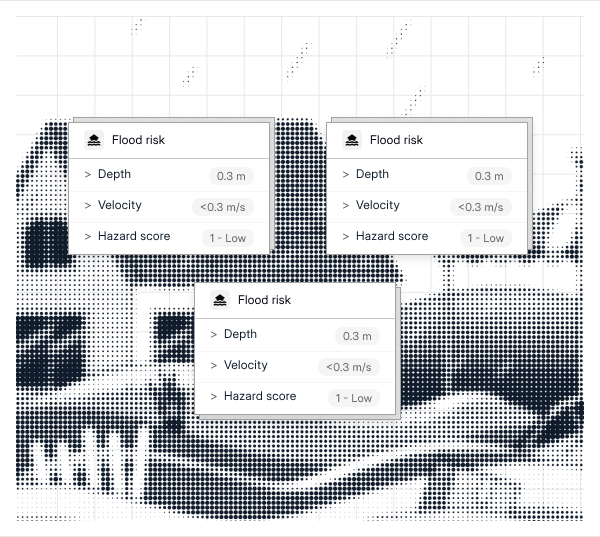
Present-day risk
Depth, velocity and hazard metrics so you see more than a simple zone code for each property or location.
Depth and velocity bands
Return clear depth and velocity bands for each property so you can see how high and how fast water is expected to move.
Hazard scores you can act on
Use standardised hazard scores that reflect danger to people and buildings so you can distinguish nuisance events from serious risk.

Flood risk
Low
>
Depth
0.3 m
>
Velocity
<0.3 m/s
>
Hazard score
1 - Low
Flood risk
Low
>
Depth
0.3 m
>
Velocity
<0.3 m/s
>
Hazard score
1 - Low
Flood risk
Moderate
>
Depth
0.3 m
>
Velocity
<0.3 m/s
>
Hazard score
1 - Low
Future climate scenarios
Understand how each location's flood risk profile shifts under 2080 climate scenarios and longer term climate assumptions.
2080 climate scenarios
Get present-day metrics alongside 2080 climate-adjusted scenarios so you can see how flood risk is expected to shift over time.
Long-term asset view
Evaluate long-lived assets, mortgage books and infrastructure against both today's exposure and future climate pathways in a single response.

Future risk increase
Low
Moderate
This location's flood risk is expected to rise by 2080.
Present-day
2080 climate
>
Depth
0.3 m
0.8 m
>
Velocity
<0.3 m/s
0.7 m/s
>
Hazard score
1
2
Future risk increase
Low
Low
Flood risk stays low under 2080 climate assumptions.
Present-day
2080 climate
>
Depth
0.2 m
0.3 m
>
Velocity
<0.3 m/s
0.4 m/s
>
Hazard score
1
1
Historic flooding
Bring decades of historic flood events into a single, consistent view so you can see where flooding has actually occurred.
Historic flood outlines
Access more than 50,000 historic flood outlines dating back to 1946 so you can see where flooding has actually occurred.
Proximity to past events
Check how close each property sits to previous flood extents to support eligibility rules, due diligence and site screening.
Historic flood outlines
Access more than 50,000 historic flood outlines dating back to 1946 so you can see where flooding has actually occurred.
Proximity to past events
Check how close each property sits to previous flood extents to support eligibility rules, due diligence and site screening.

Historic flood at this site
2007
>
Event type
River flooding
>
Max recorded depth
0.4 m
>
Return period
≈1‑in‑50 year event
>
Status line
Inside 2007 flood extent
Historic flood record
4 records
>
Events within 1 km
4 events
>
Most recent event
2015
>
Highest local depth
0.7 m · 2015
>
Status line
Recorded historic flooding
Proximity to past events
120 m
>
Closest event year
1998
>
Event type
Surface water flooding
>
Direction
Upstream
>
Status line
Near
Reservoir and extreme scenarios
Add reservoir breach and other low probability, high impact scenarios when you need to extend analysis beyond everyday flood conditions.
Reservoir breach scenarios
Include dry day, wet day and fluvial reservoir breach scenarios using the same fields as everyday risk for easier analysis.
Low probability, high impact
Model rare but severe flood events for stress tests, regulatory reporting and edge case handling without a separate data source.

Reservoir breach
>
Scenario type
Wet day breach
>
Distance to reservoir
2.3 km
>
Modelled depth
1.2 m
>
Velocity
0.8 m/s
>
Hazard score
2
>
Event likelihood
< 1-in-10,000
Extreme stress-test event
>
Scenario type
Reservoir breach
Fluvial flooding
>
Peak depth
2.1 m
>
Peak velocity
1.5 m/s
>
Hazard score
3
>
Event likelihood
1-in-10,000
Query options
Work with the addresses, identifiers and geometry that already power your stack so flood data fits cleanly into existing workflows.
Flexible query inputs
Query by address, UPRN, postcode, coordinate, bounding box or polygon so flood data fits the identifiers you already use.
Aligned with your maps
Receive results indexed in WGS84 with filters for band, source and scenario so responses line up cleanly with your maps and workflows.

Map geometry
237 properties
>
Input type
Polygon
>
Centroid
51.5074, -0.1278
>
Area
12,450 m²
>
Perimeter
445 m
Address & IDs
1 match
>
UPRN
100023336956
>
Postcode
SW1A 1AA
>
Address line 1
10 Downing Street
>
City
London
Aligned with your maps
1 match
>
Coordinate system
WGS84
>
Data format
GeoJSON
>
Units
Metric
>
Returned fields
Depth
Velocity
Hazard
Flood risk intelligence in action
See how insurers, lenders and asset owners use property‑level flood data to price risk, protect portfolios and plan resilient assets.
01
Mortgage origination
Query by UPRN at application, receive risk band and flood depth instantly, and flag high-risk collateral before underwriting begins.

02
Portfolio risk management
Score your entire book at property level and stress-test under 2°C and 4°C climate scenarios for regulatory and board reporting.

03
Insurance underwriting
Replace postcode banding with UPRN-precise scores at point of quote to price more accurately and reduce adverse selection.

04
Planning integration
Assess flood exposure by UPRN or coordinate before consent is granted, integrated into existing planning workflows via API or bulk file.

05
TCFD and regulatory disclosure
Property-level physical risk data for TCFD, PRA SS5/25, and EBA reporting, with climate scenarios and model governance documentation included.

Other datasets, same integration
Use the same API key to turn on additional datasets whenever you need them, from risk and environment to geography and market context.

Planning intelligence
Work with structured planning applications, documents, and policies to analyse development activity and decisions at scale.
Explore Planning intelligence

Address lookup
Resolve any UK address to a verified UPRN, coordinates, and administrative geography in a single call.
Explore Address lookup

Coastal erosion
Property-level erosion scores, encroachment timelines, and coastal defence intelligence for every UK coastal address.
Explore Coastal erosion